Built for small teams that value clarity over complexity

Create a Gantt Chart Online Fast

Build your project timeline in seconds. Add tasks, drag to schedule, connect dependencies in minutes.

  • Free forever. One project, up to 10 team members, full Gantt chart — no credit card.
  • Live in under 60 seconds. Type your first task and your Gantt chart is ready immediately.
  • No learning curve. If you can type a task name and drag a bar, you can use SimpleGantt.

Free for one project  ·  Premium $8 / month for unlimited users & more projects

Create Your Free Project

No credit card required

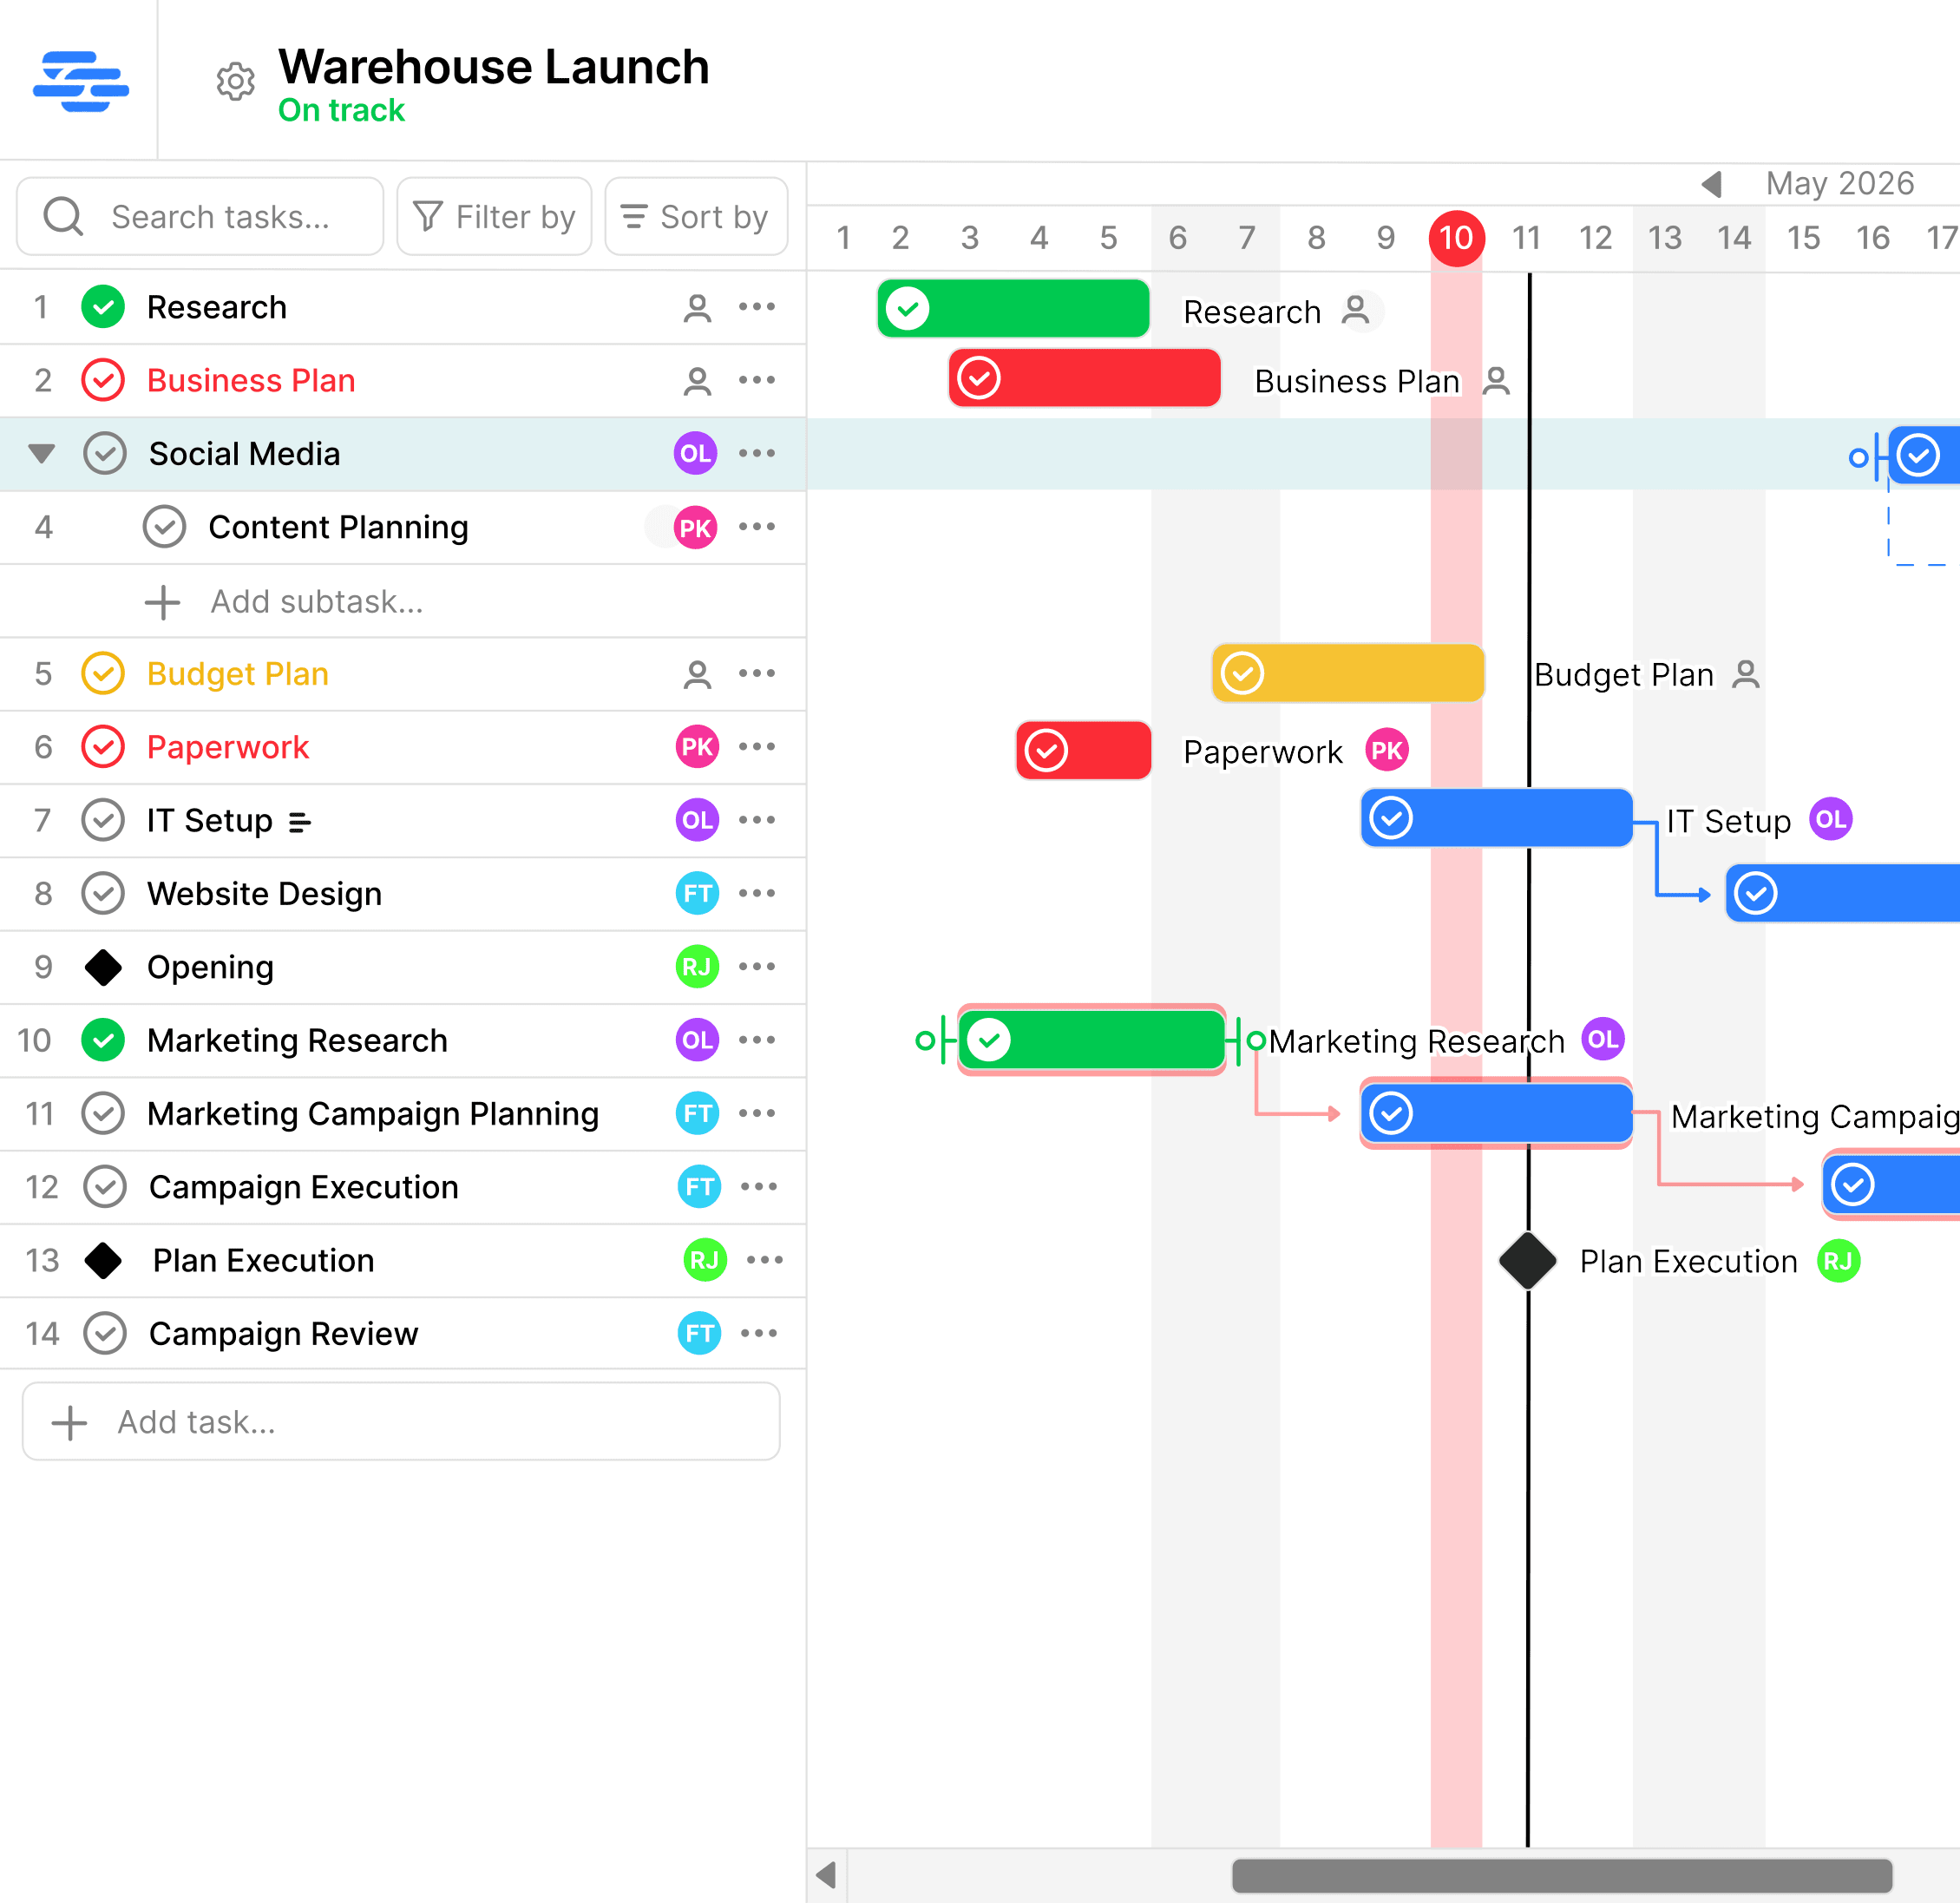
Simple Gantt app — Gantt chart project timeline view
★★★★★5 / 5 from early usersFree plan — no credit card requiredCancel anytimeUsed by project managers & small teams
★★★★★

Clean, intuitive interface. Creating tasks and placing them on the timeline is quick and straightforward, without unnecessary steps. I especially liked task dependencies — they make it much easier to organise and prioritise work.

Mateusz K.

Project Manager, SyntraStudio

★★★★★

It focuses on what really matters instead of overwhelming users with unnecessary features. Setting up a project and adding tasks felt very intuitive — there are multiple ways to accomplish the same task depending on your workflow.

Bartosz W.

Student Council Chairman, Faculty of Electrical & Computer Engineering

Three steps to your first Gantt chart

No tutorials. No templates to configure. Just your project, live in seconds.

1

Add tasks

Type your project tasks into the list. Press Enter to add each one — your Gantt chart populates in real time.

2

Drag to schedule

Drag each task bar to set its start date and duration. Your full project timeline takes shape in minutes.

3

Connect dependencies

Draw arrows between tasks to link them. When one task moves, everything that depends on it shifts automatically.

Stop rebuilding project timelines with spreadsheet formulas.

Spreadsheets can be turned into project timelines, but dependencies, schedule risk and changes usually require formulas and ongoing manual maintenance.

Excel / Google Sheets

  • Visual timelines require manual configuration
  • Dependencies must be tracked manually
  • Schedule-risk indicators require custom formulas
  • Changes can be difficult to communicate clearly
  • Multiple versions can create confusion

SimpleGantt

  • Status calculated from task dates — automatically
  • Drag-and-drop visual Gantt timeline
  • Dependency arrows show what's blocking what
  • Everyone sees the same live schedule
  • On Track, At Risk or Delayed — visible at a glance
Try SimpleGantt Free

No credit card required · Free for one project

Everything a Gantt chart maker should do

Create, share, and track your project timeline without the complexity.

Ready in seconds

Your first Gantt chart is live the moment you sign up. No onboarding wizard, no sample data to delete — just a blank chart ready for your project.

Built for teams

Invite your whole team and assign tasks directly on the chart. Everyone sees the same live timeline — no exports, no syncing required.

Schedules that update themselves

Connect tasks with dependency arrows. Move one task and all dependent tasks shift with it automatically — no manual rescheduling.

Automatic status trackingLive updates

Your Gantt chart tracks itself

Every task automatically shows whether it is On Track, At Risk, or Delayed — based on real dates. No manual status updates. No status meetings. Your chart always reflects reality.

Simple Gantt chart showing on-track, at-risk, and delayed task statuses automatically
Team assignmentsMilestones

Assign tasks right on the timeline

Click any task to assign it to a team member. Set milestones for key deliverables. Invite everyone — SimpleGantt charges one flat rate, not per person.

Assigning tasks to team members directly on the Gantt chart
Drag-and-drop schedulingTask dependencies

Set deadlines. See what is at risk.

Pin your project deadline on the chart and watch the timeline tell you the truth. Tasks that cross the deadline are highlighted automatically — no spreadsheet math needed.

Gantt chart with a red deadline marker and drag-and-drop task scheduling

Your project, on one clear Gantt chart

Tasks, dependencies, team assignments, and deadlines — all in one visual timeline.

Simple pricing. Unlimited teammates.

Start for free and upgrade when you're ready. Bring everyone on board without paying more.

Free

$0forever

Get started with no commitment

  • 1 project
  • Up to 10 users
  • Up to 50 tasks
  • Full Gantt chart
  • Task dependencies & milestones
Get started

Premium

$8/ month

For teams that are growing

  • Up to 20 projects
  • Unlimited users
  • Unlimited tasks
  • Full Gantt chart
  • Task dependencies & milestones
  • Templates
  • Statistics
Start Premium

Enterprise

$75/ month

For organisations at scale

  • Unlimited projects
  • Unlimited users
  • Unlimited tasks
  • Full Gantt chart
  • Task dependencies & milestones
  • Templates & statistics
  • Roles & permissions
  • Multiple project admins
  • Priority support
Start Enterprise
Upgrade only when you need more projectsCancel Premium anytimeYour free project remains available

Frequently asked questions

Everything you need to know about creating your first Gantt chart.

How do I create a Gantt chart online?

Sign up for SimpleGantt — free, no credit card. Your first project is created automatically. Type tasks into the sidebar, drag their bars to set dates, and draw arrows between tasks to add dependencies. Your Gantt chart is fully interactive from the first task you add.

Is this Gantt chart maker free?

Yes. The free plan gives you one full project, up to 10 team members, and up to 50 tasks — with the complete Gantt chart experience: drag-and-drop scheduling, dependencies, milestones, and automatic status tracking. No credit card required and no time limit.

How long does it take to make a Gantt chart?

Under 60 seconds for the first version. Sign up, and your blank Gantt chart is ready immediately. Add your first task, drag it to a start date, and your project timeline is live. Most users have a working chart for a real project within a few minutes.

What can I do with a Gantt chart?

A Gantt chart lets you visualise your project timeline — what needs to happen, in what order, and by when. In SimpleGantt you can drag tasks to reschedule, draw dependency arrows so linked tasks shift together, assign tasks to team members, and track whether each task is On Track, At Risk, or Delayed — automatically.

Can I share my Gantt chart with my team?

Yes. Invite team members by email and they can view or edit the Gantt chart immediately. You can assign tasks directly to them on the timeline. Paid plans support unlimited team members for one flat monthly price.

Does it work for any type of project?

Yes. SimpleGantt works for any project that has tasks, dates, and people — software development, marketing campaigns, construction, events, onboarding plans, and more. If your project has a start, an end, and things that need to happen in between, a Gantt chart will help.

Do I need to install anything?

No. SimpleGantt runs entirely in the browser. Nothing to download, nothing to install. It works on Mac, Windows, and any modern browser.

Can I cancel anytime?

Yes. Cancel at any time. Your plan stays active until the end of your current billing period with no further charges.